Just the Facts

2023 First-year Class Data

Pie Chart showing a class size of 150 students with 44% female, 55% male, and 1% other
Class Size
42 %
Nebraska Residents
58 %
Out of State Students
26
States Represented
24.08
Average Age
17 %
Students Over the Age of 27
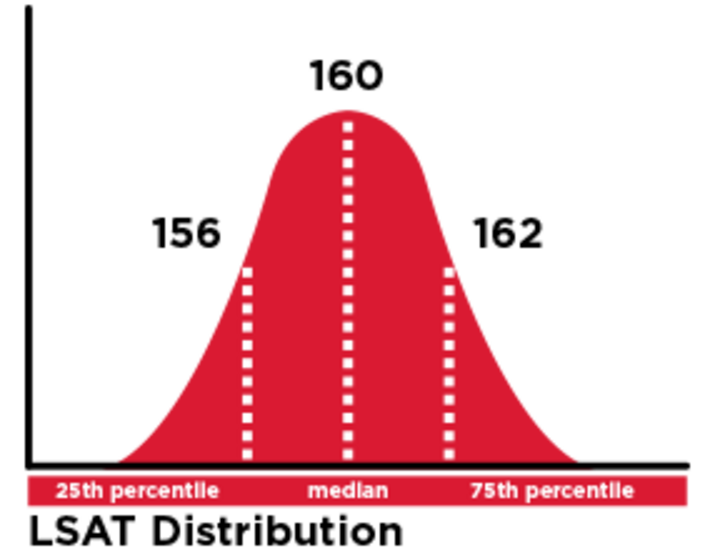
Graph showing a 25th percentile of 154, a median of 158, and a 75th percentile of 160
LSAT Distribution
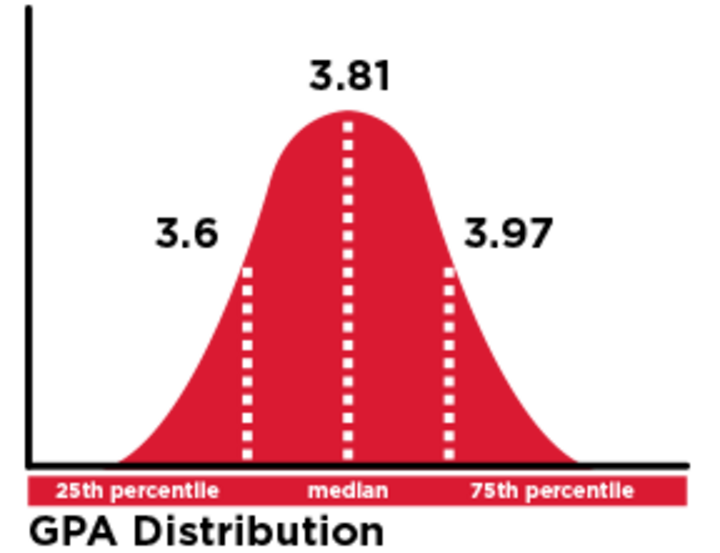
Graph showing a 25th percentile of 3.48, a median of 3.75, and a 75th percentile of 3.93
GPA Distribution

2022 Graduate Class Data

Private Practice
53%
Business or Corporate
14%
Public Interest / Non-Profit
10%
Government
10%
Judicial Clerkship
8%
Academic
5%


Employment Categories
Map showing 11 states highlighted in a dark blue
Employed in 11 States
92 %
Employed in Bar Passage Required and J.D. Advantage Positions
94 %
2020 Ultimate Bar Passage
77 %
Employed at Graduation
93 %
Employed Within 10 Months of Graduation